We’re 80 games into the 2017 season (Total 240 games). And from the 2017 general attendance stats it shows an increase in attendance when comparing with 2016 full year record.
2017 vs 2016 full year attendance record
- CPBL overall up by 0.82%
- Fubon Guardians up by 21.26%
- Uni-Lions up by 4.54%
- Lamigo Monkeys up by 3%
- Chinatrust Brothers down by 13.57
But how does the 2017 stats stack up against 2016 record if comparing it game-by-game? The result is actually quite interesting. Of course being it’s game-by-game comparison the obvious weekend/theme nights would also need to be considered. We’ll probably get a true reflection on the data after the 1st half-season.
2017 vs 2016 game-by-game attendance
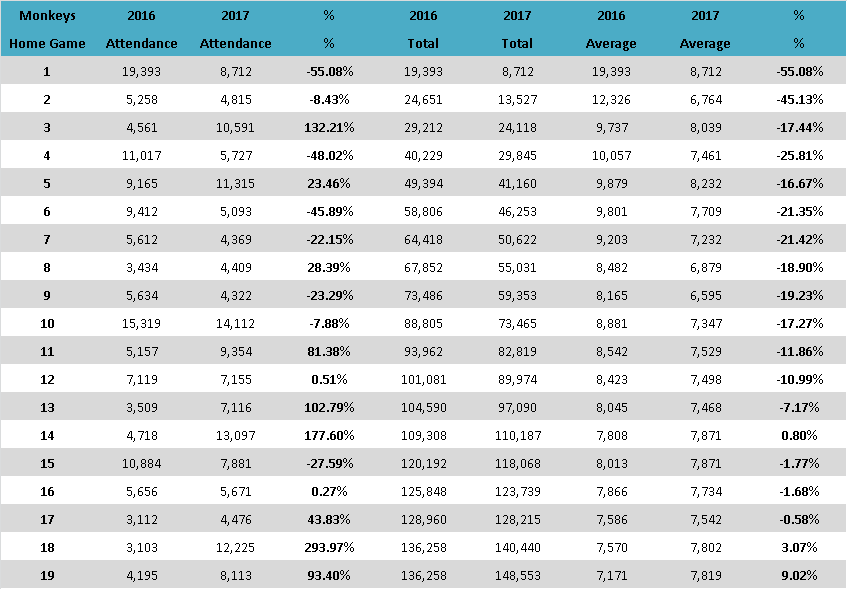
- Lamigo Monkeys up by 9.02%
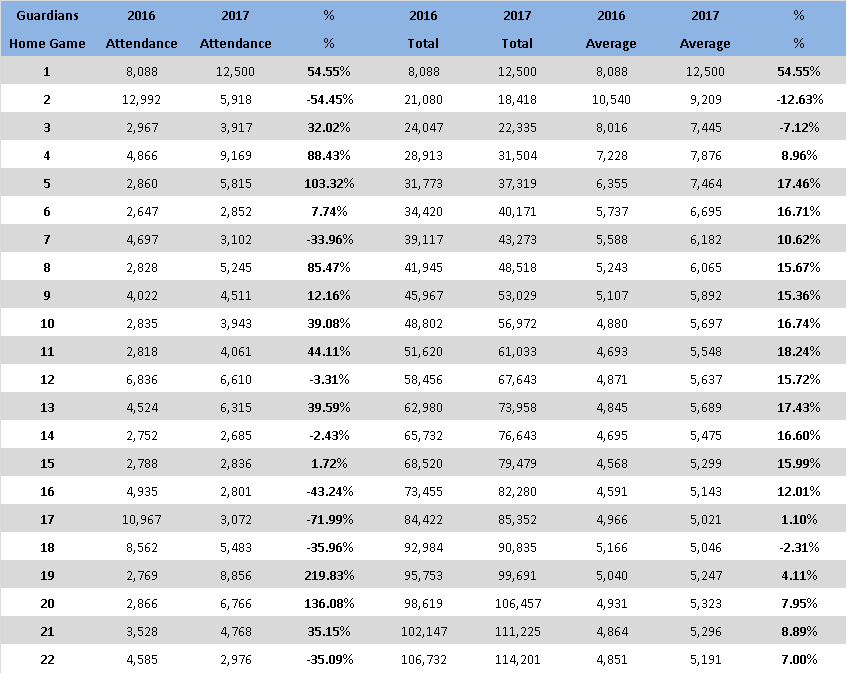
- Fubon Guardians up by 7%
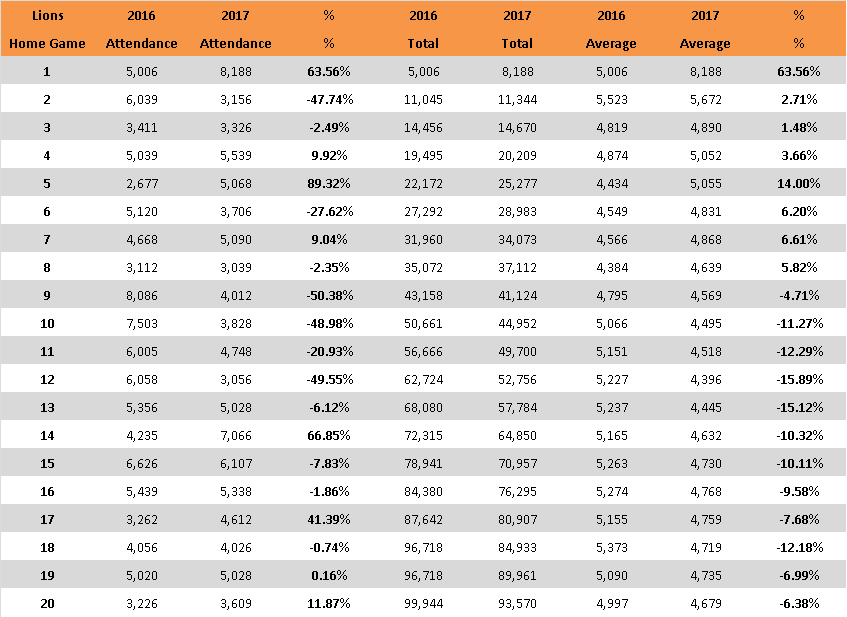
- Uni-Lions down by 6.38%
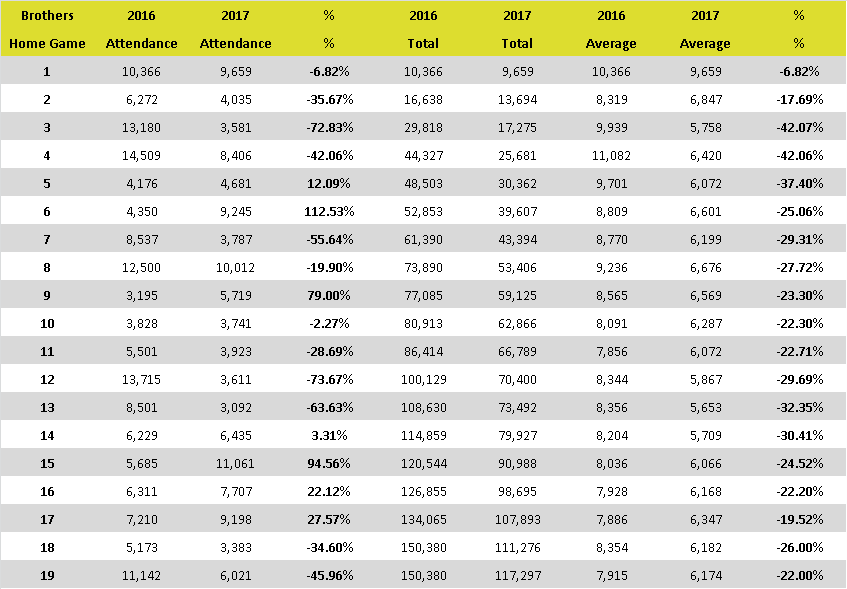
- Chinatrust Brothers down by 22%
Chinatrust Brothers 2017 vs 2016 game-by-game attendance
Uni-Lions 2017 vs 2016 game-by-game attendance
Fubon Guardians 2017 vs 2016 game-by-game attendance
Lamigo Monkeys 2017 vs 2016 game-by-game attendance