


Reviewing Effectiveness of Bunts (April-May 2024)
Before the 2024 season started, a couple of teams changed their head coaches to Japan-born ones. For example, the CTBC Brothers replaced Peng Cheng-Min with Hirano Keiichi, and the Rakuten Monkeys changed theirs from Tseng Hao-Ju to Furukubo Kenji.
Over the years, people have tended to assume that Japanese coaches are fond of “small ball tactics,” which emphasise advancing runners into scoring positions through stealing bases, hitting-and-running, and bunting. However, this assumption does not always hold true.
Up until May 12, the Brothers had the most bunting attempts, with 47, while the Monkeys had only tried 23 times, second to last in the league, ahead of only the Uni-Lions by one attempt. Although the Brothers attempted to bunt frequently, their success rate was relatively high. The league’s current success rate is around 78%, and the Brothers’ success rate is 81%, placing them third in the league.
Win Probability Added (WPA):
One way to compare the effectiveness of bunting among teams is to look at the Win Probability Added (WPA) for each bunt attempt. WPA quantifies the percent change in a team’s chances of winning based on the outcome of each play. For instance, if a team’s winning percentage is 50% and a home run increases it to 65%, the player who hit the home run gains 0.15 WPA, meaning he contributes 0.15 “wins” to the team.
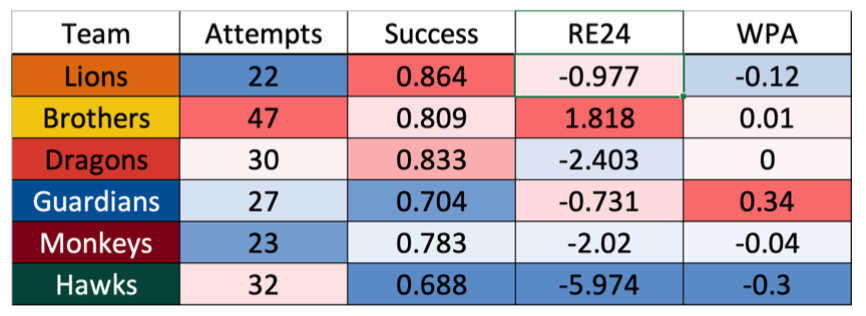
The graph above shows that despite having the second-lowest bunting success rate, the Guardians have the highest WPA at 33%. This suggests the Guardians achieve the best outcomes when bunting.
The bunt that added the most win probability occurred on May 5 in the top of the 11th inning against the Brothers. This play increased their chances of winning by 29%, though they eventually lost the game. Summing up the WPA values for each team, the overall result is not surprising: -11%, suggesting that bunting might not be the best strategy for winning games.
Run Expectancy (RE24):
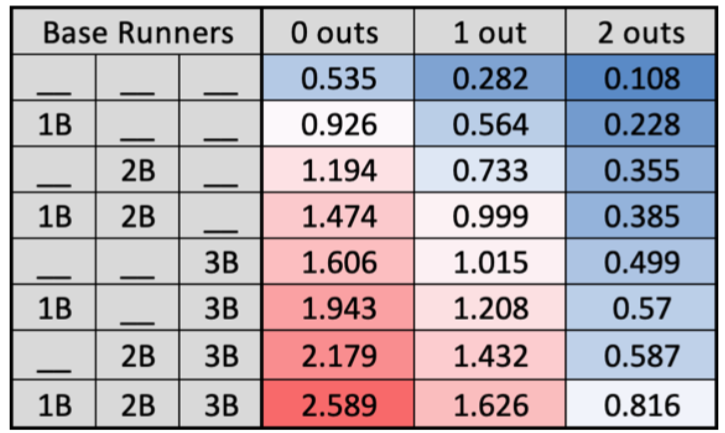
Another way to evaluate the effectiveness of bunting is by examining the change in run expectancy, known as RE24, which considers the 24 possible base-out states. Every scenario, like the number of runners on base and outs, has its corresponding average number of runs a team will score in the remainder of the half-inning.
People can use this stat to know how many runs a player has “earned” for the team in a plate appearance. The formula for RE24 is: (run expectancy of the end state) – (run expectancy of the beginning state) + (runs scored).
Surprisingly, the Brothers have the highest RE24 despite the RE24 of bunting from no outs runner on first base to one out runner on second base is negative according to the run expectancy matrix below.
The main reason for this outcome is that the Brothers have earned 3 points in all the bunting attempts, and according to the equation of RE24, a point is an additional 1 point for RE24. On the other hand, the Lions did not earn any points in their bunting attempt, and the rest of the team earned one point each. But still, the overall effect of bunting will not benefit scoring runs based on the sum of RE24.
Currently, the Brothers have 33 sacrifice bunts in 33 games, putting them on pace to surpass their record of 106 sacrifice bunts set during the 2021 season—the highest number made by any team in six years. More surprisingly, the Brothers currently have the second-best OPS+ in the league. There may be various reasons behind the decision to bunt frequently, but in the long run, excessive bunting might not be the best strategy for winning many games.
The percentages used to calculate the WPA for the graph above and the run expectancy values for CPBL are based on the numbers provided by rebas.tw


