2019 CPBL Attendance Review
After 240 regular-season games and five games in the 2019 Taiwan Series, another year of the CPBL season is in the bag. As always, here is the end of season review for the 2019 CPBL attendance record.
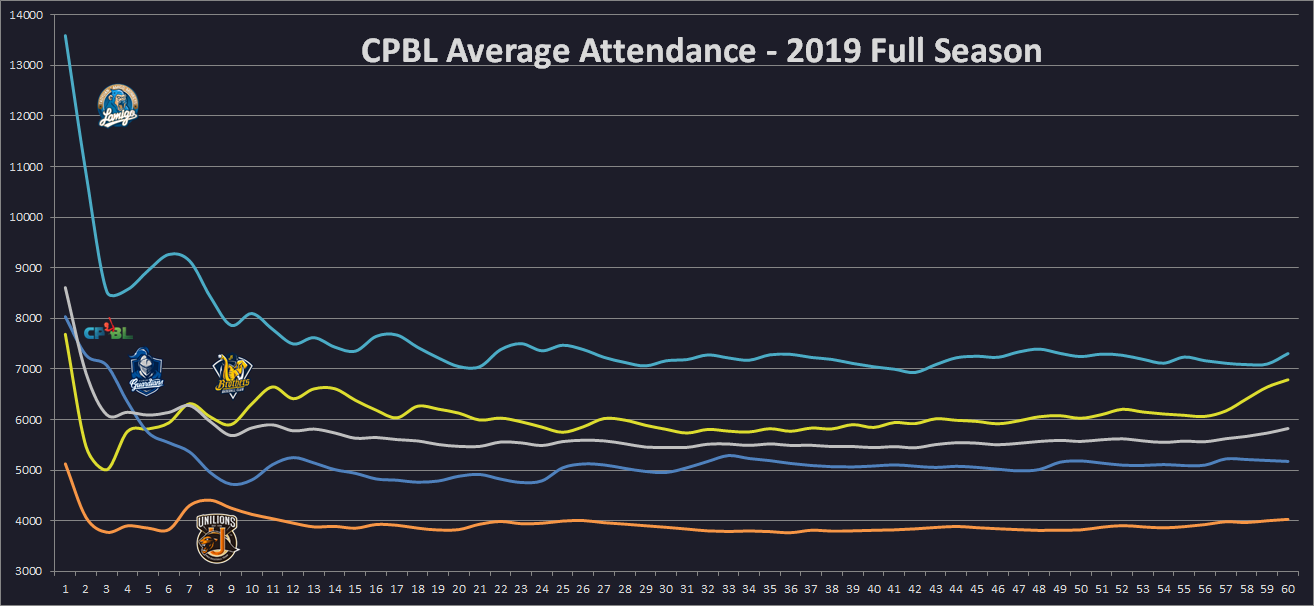
In 2019, the CPBL attracted a total 1,398,246 fans across 240 games, an average of 5826 per game. Comparing with 2018 data, the league sees an increase of 6.76%.
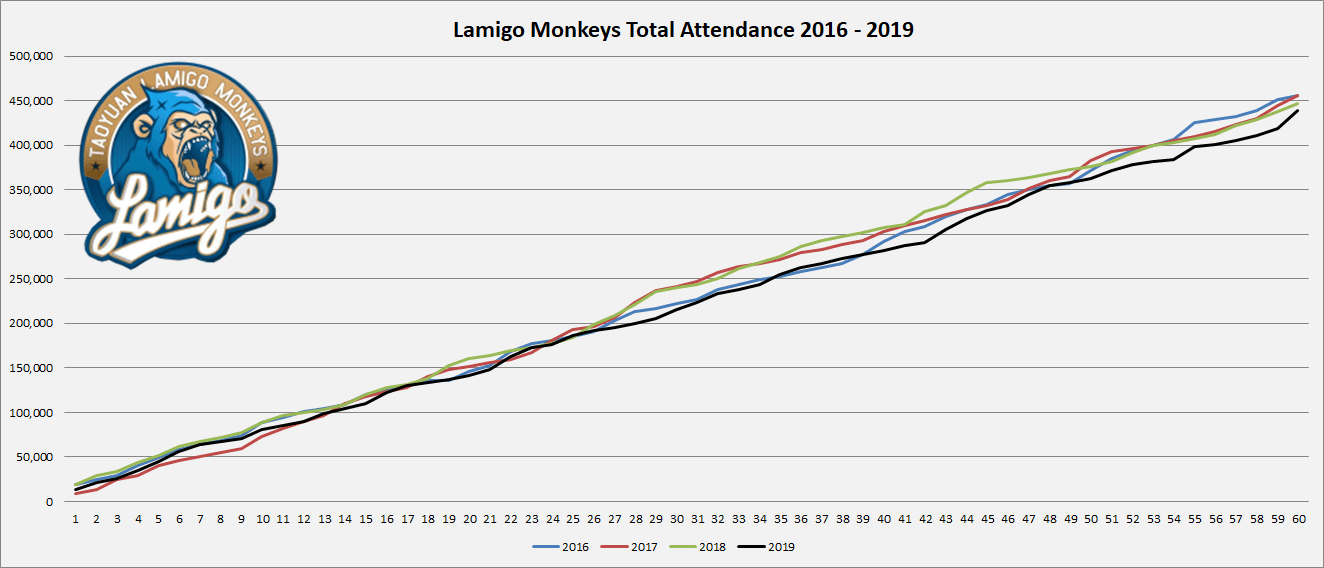
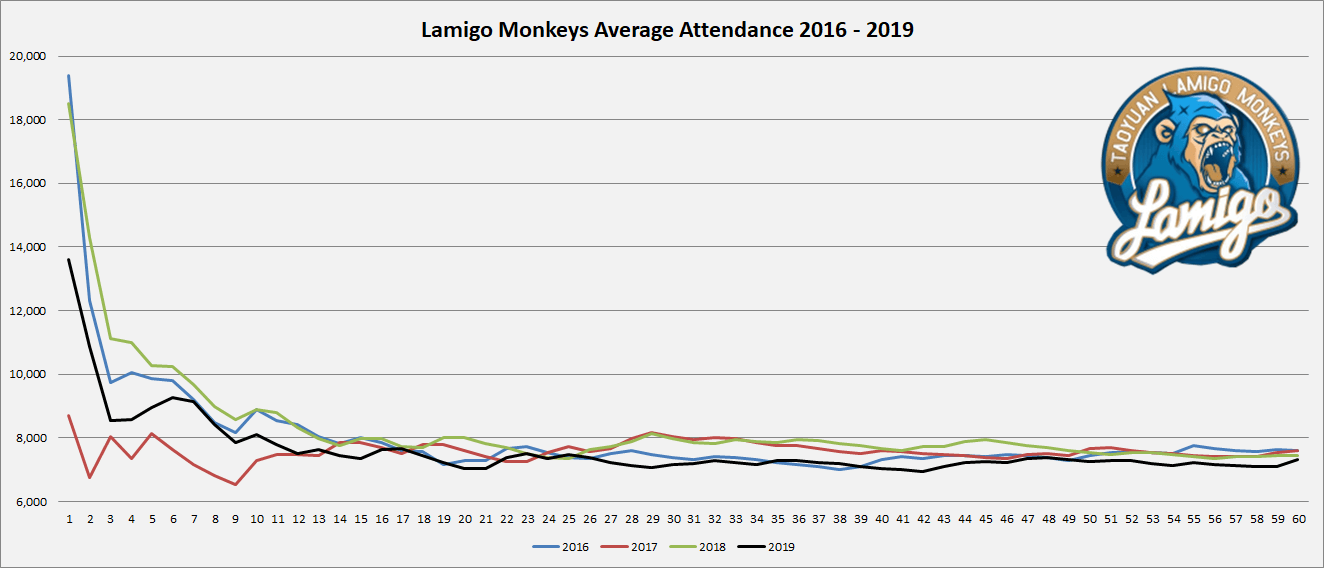
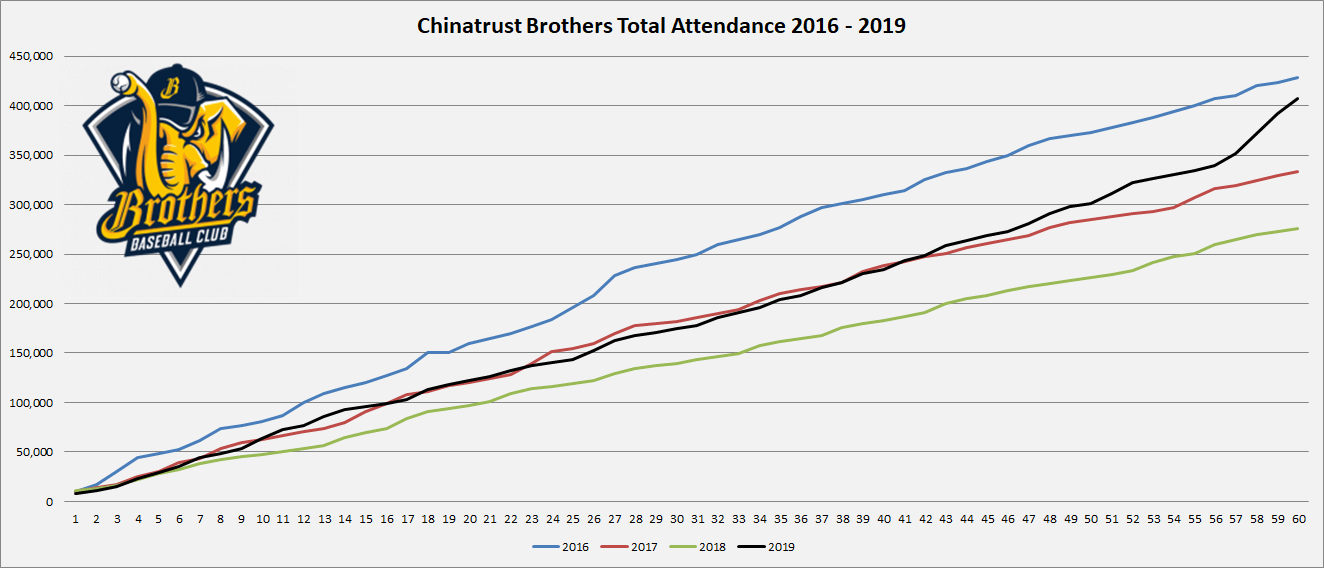
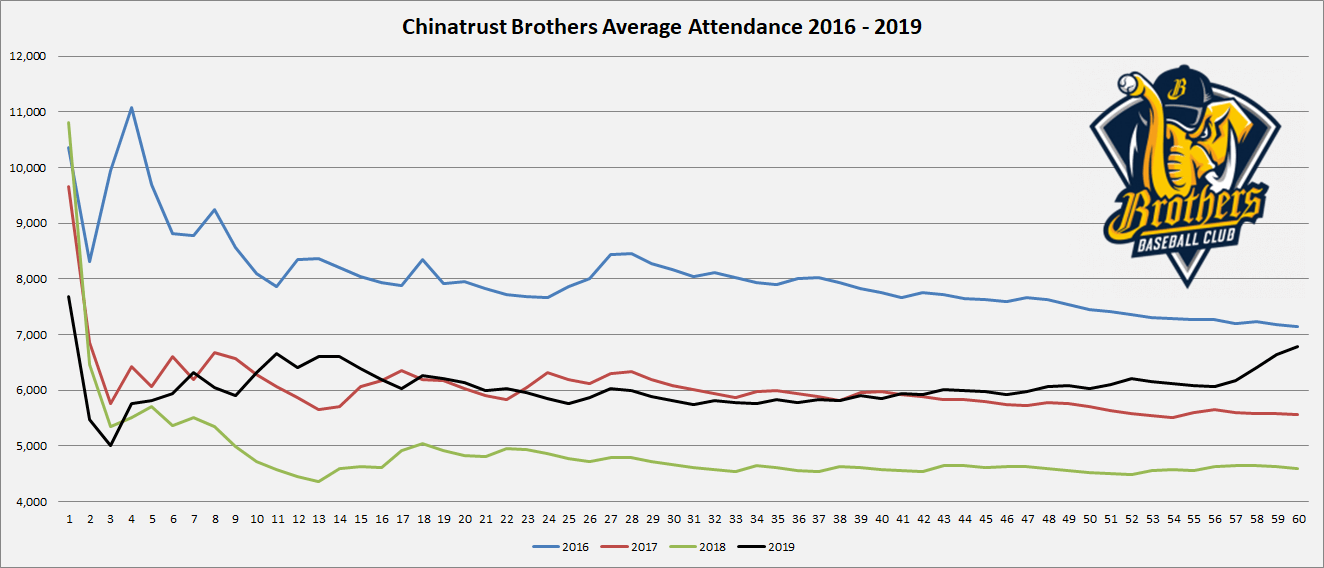
The Lamigo Monkeys once again topped the league with an average attendance of 7308, compared with 2018, they had a 1.85% drop. The Chinatrust Brothers had a massive 47.67% increase in attendance coming in second with an average of 6790.
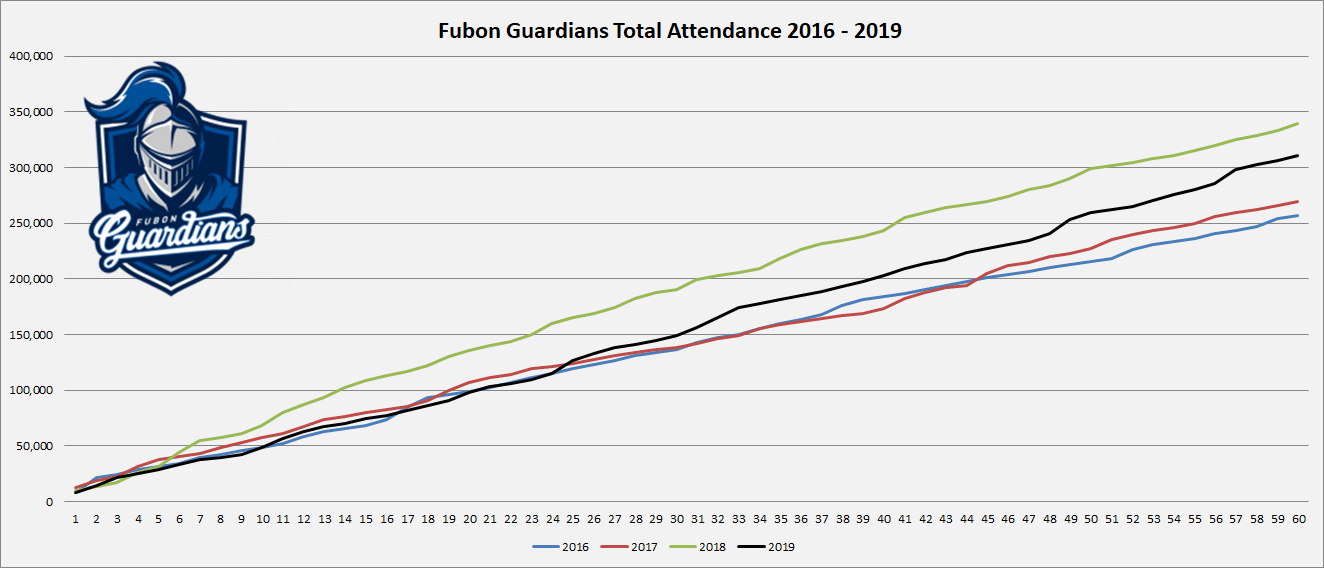
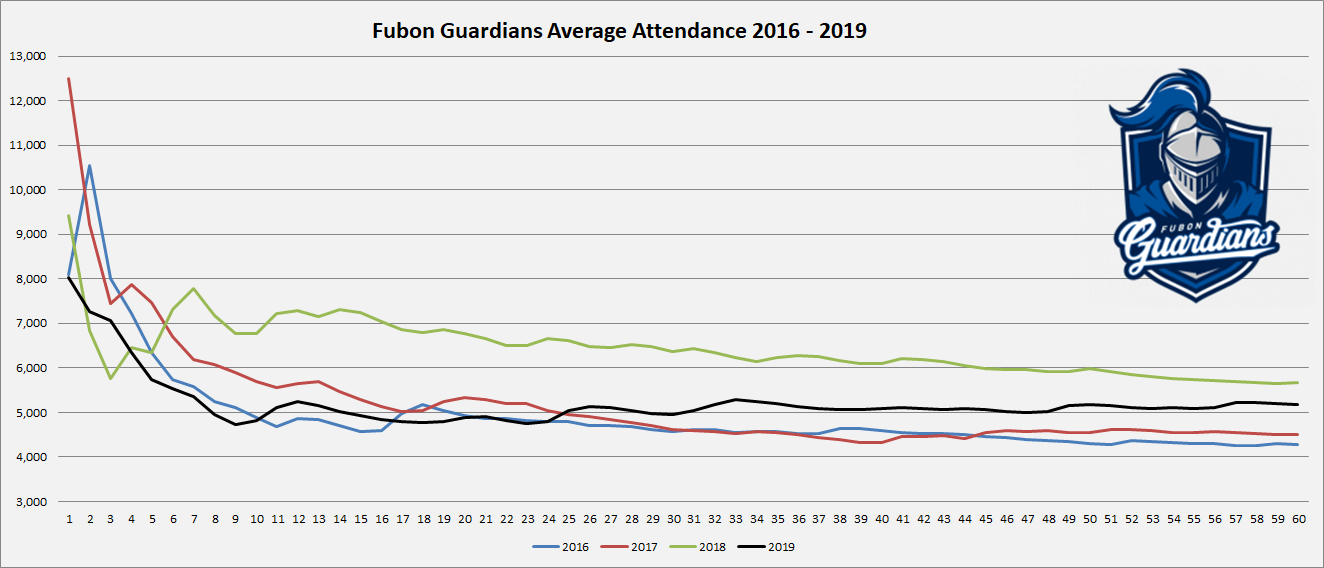
Things are not looking well for the Fubon Guardians and the Uni-Lions, as the Guardians suffered a drop of 8.65% in average attendance with 5175. The Uni-Lions came in last with 4031 fans per game. However, it was only a minor 2.16% dip.
| 2019 Attendance | Games | Total | Average | vs 2018 |
| Lamigo Monkeys | 60 | 438,460 | 7308 | Down 1.85% |
| Chinatrust Brothers | 60 | 407,401 | 6790 | Up 47.67% |
| Fubon Guardians | 60 | 310,499 | 5175 | Down 8.65% |
| Uni-Lions | 60 | 241,886 | 4031 | Down 2.16% |
| CPBL | 240 | 1,398,246 | 5826 | Up 6.76% |
2019 Taiwan Series Attendance
The 2019 Taiwan Series was a showdown between the two of the most popular teams in the CPBL, the Lamigo Monkeys and Chinatrust Brothers. The Monkeys defeated the Brothers 4-1 in the best-of-seven series.
A total of 85,349 fans showed up across five games during the 2019 Taiwan Series. The average attendance for the entire series is at 17,070 with 88% of the stadium capacity rate.

| Taiwan Series | Stadium | Total | Capacity | % |
| Game 1 | Taoyuan | 20,100 | 20,000 | 101 |
| Game 2 | Taoyuan | 18,610 | 20,000 | 93 |
| Game 3 | Taichung | 11,176 | 19,000 | 59 |
| Game 4 | Taichung | 16,110 | 19,000 | 85 |
| Game 5 | Taichung | 19,353 | 19,000 | 102 |
| Total | Stadium | 85,349 | 97,000 | 88 |
Attendance Per Game Chart
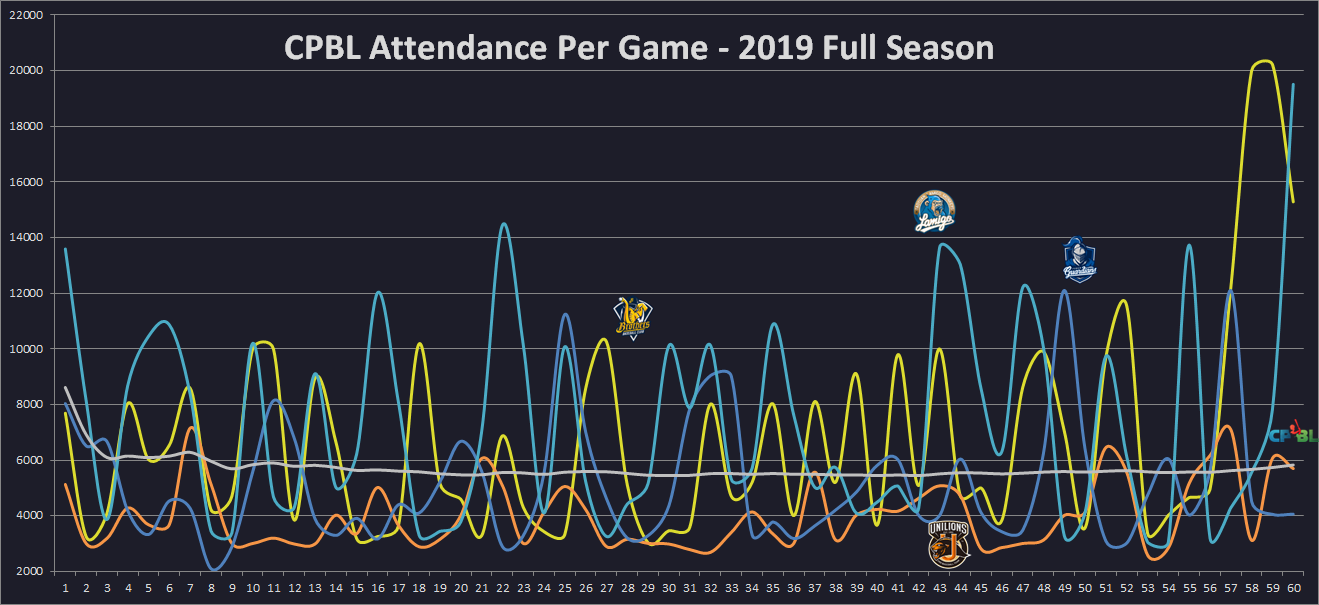
Total Attendance Chart
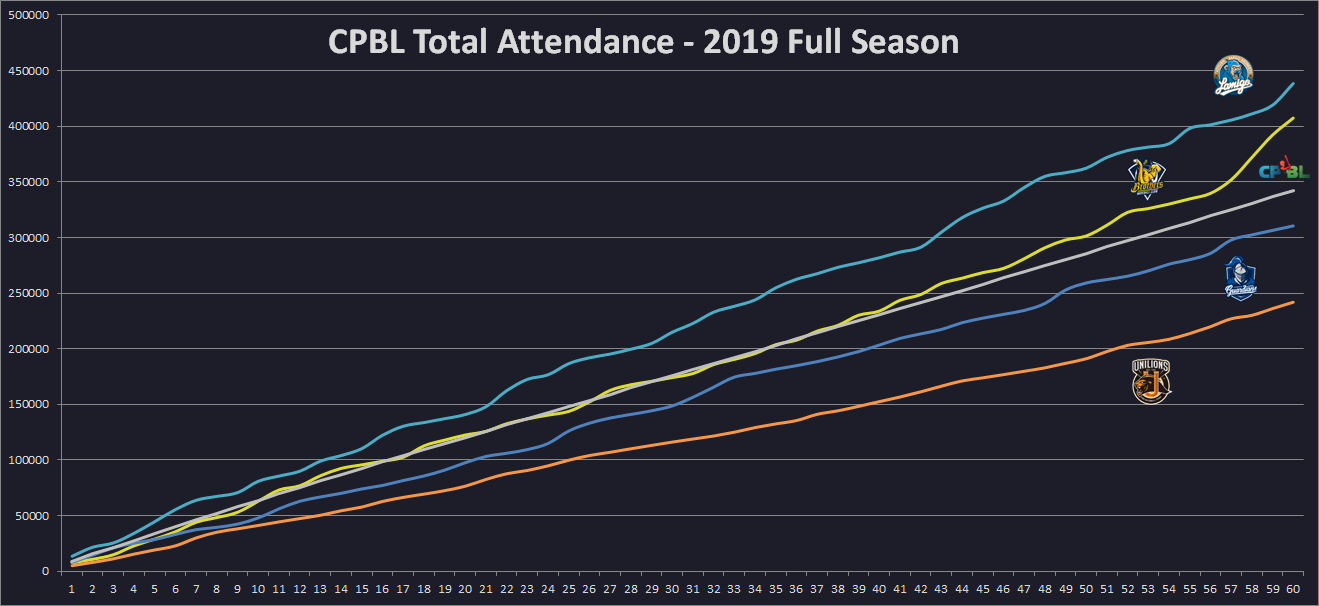
Average Attendance Chart
Attendance Plus Chart (ATT+)
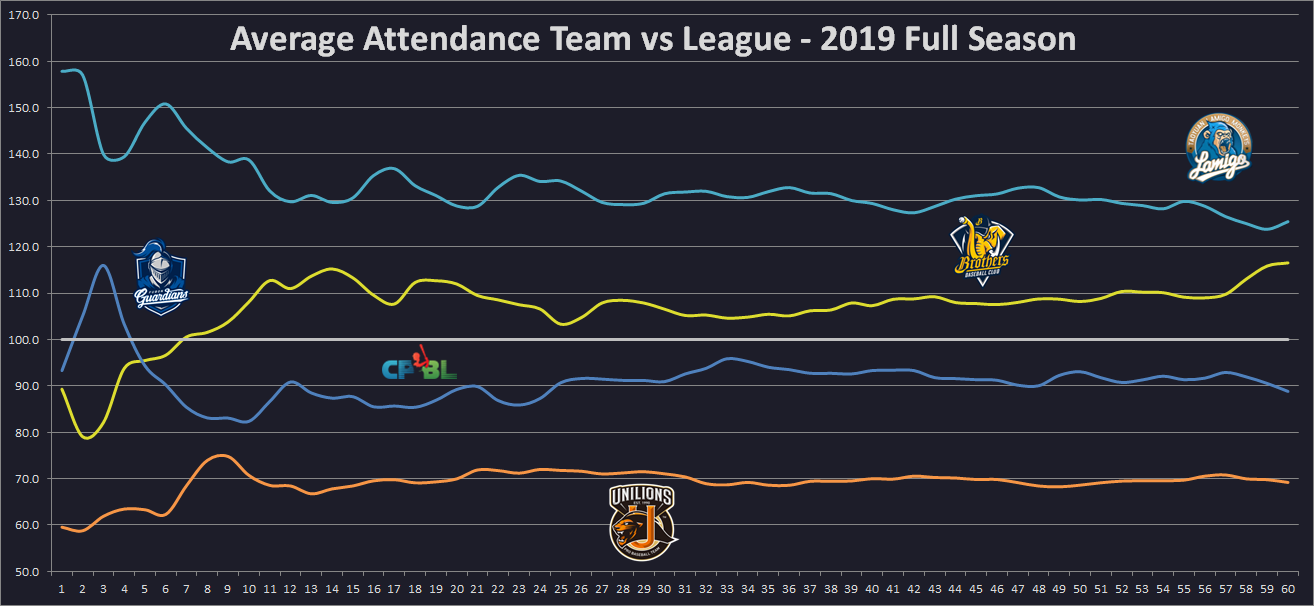
Here is the “average team attendance vs the average league attendance”. In a way, we can call it “ATT+”. Just think of this as the “OPS+”, but for team attendance.
So, how do we use this? The league average will equal to 100. If a team’s ATT+ is 160, then the team is performing 60% better than the average league attendance. Whereas if a team’s ATT+ is at 60, then that team is 40% lower than the average league attendance.
- Lamigo Monkeys: 125 ATT+ 25% above league average
- Chinatrust Brothers: 117 ATT+ 17% above league average
- Fubon Guardians: 89 ATT+ 11% below league average
- Uni-Lions: 69 ATT+ 31% below league average
Cities Attendance Breakdown
| City | Total Games | Average Attendance | vs 2018 |
| Taoyuan | 60 | 7308 | Down 1.85% |
| Xinzhuang | 60 | 5175 | Down 7.09% |
| Taichung | 46 | 6739 | Up 53.49% |
| Tainan | 41 | 4025 | Down 5.96% |
| Kaohsiung | 15 | 4811 | Up 36.07% |
| Tianmu | 11 | 6322 | Up 10.41% |
| Hualien | 7 | 4651 | Down 0.28% |
Monthly Attendance Breakdown
| Monthly Attendance |
Total Games | Average Attendance |
| March | 12 | 5841 |
| April | 36 | 5980 |
| May | 39 | 4759 |
| June | 33 | 5548 |
| July | 32 | 5535 |
| August | 45 | 5944 |
| September | 38 | 6506 |
| October | 5 | 10,447 |
Days Attendance Breakdown: Weekday vs Weekend
| Average Attendance | Monkeys | Brothers | Guardians | Uni-Lions | CPBL |
| Tuesday | 3820 | 6888 | 3569 | 2817 | 4443 |
| Wednesday | 4195 | 4598 | 4345 | 3425 | 4139 |
| Thursday | 4762 | 4889 | 3802 | 3489 | 4205 |
| Friday | 6895 | 5539 | 5233 | 3746 | 5418 |
| Saturday | 11,849 | 9578 | 7093 | 5061 | 8487 |
| Sunday | 8033 | 7643 | 5429 | 4461 | 6323 |
| Week Day (Mon-Fri) | 5182 | 5398 | 4423 | 3444 | 4619 |
| Weekend (Sat-Sun) | 10,088 | 8611 | 6227 | 4750 | 7405 |
CPBL Attendance 2016 – 2019 Season


Lamigo Monkeys’ Attendance 2016 – 2019 Season
Chinatrust Brothers’ Attendance 2016 – 2019 Season
Fubon Guardians’ Attendance 2016 – 2019 Season
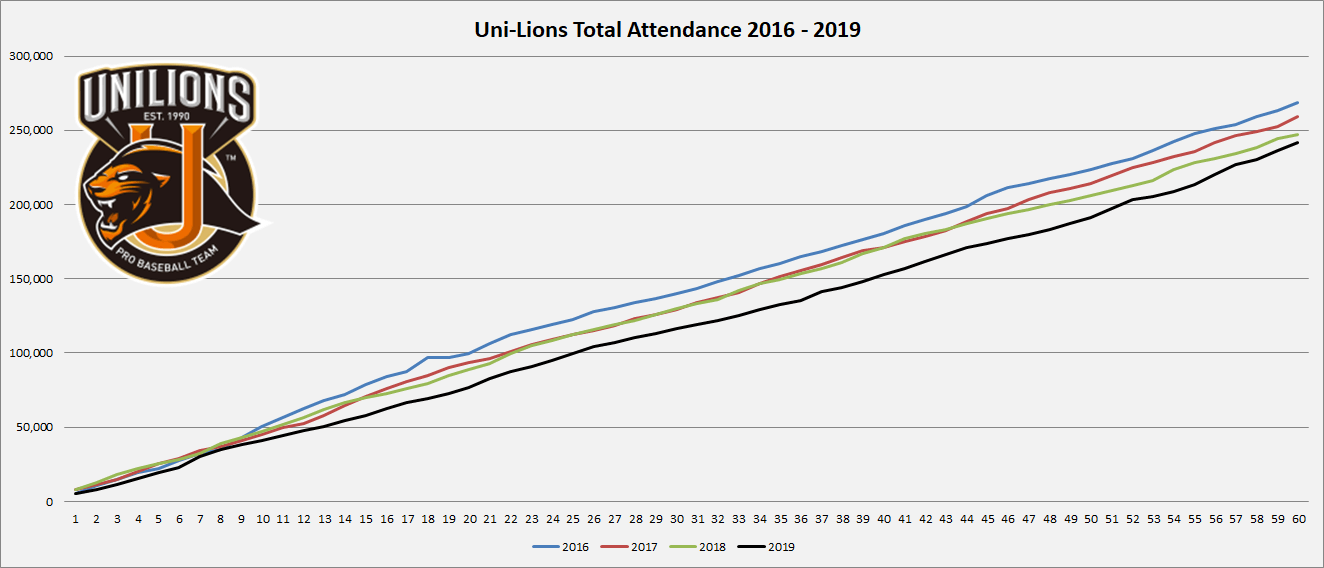
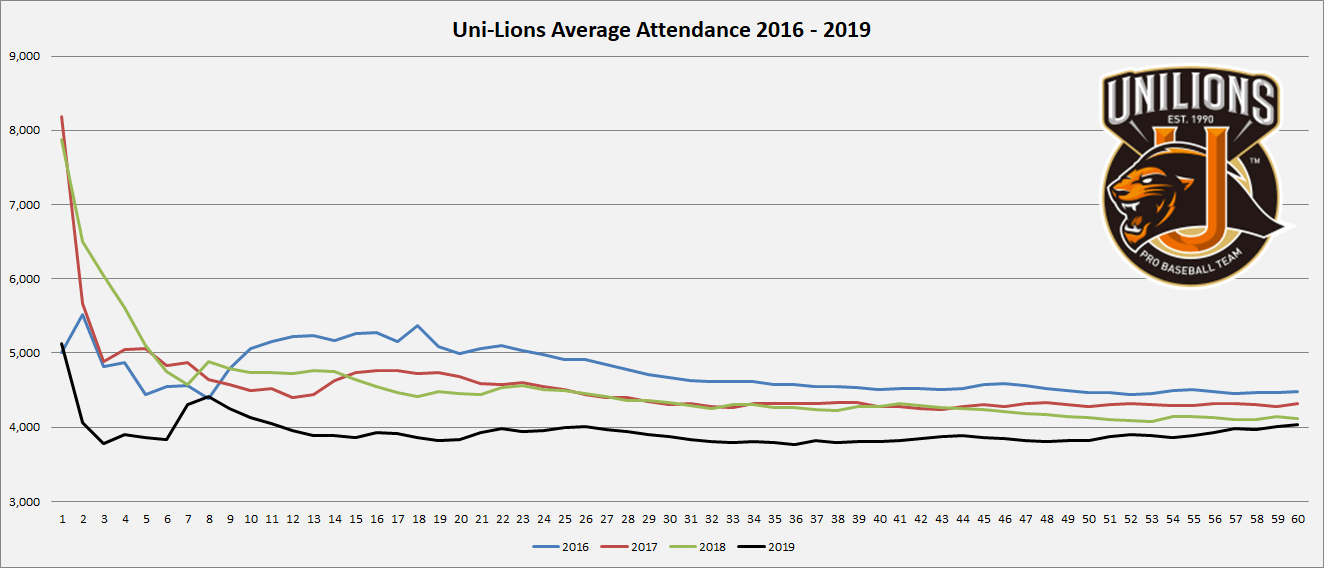
Uni-Lions’ Attendance 2016 – 2019 Season
