


2019 First Half Season Attendance
With the 2019 CPBL first half season done and dusted and teams are now preparing for the second half season, here is our 2019 first half season attendance review.
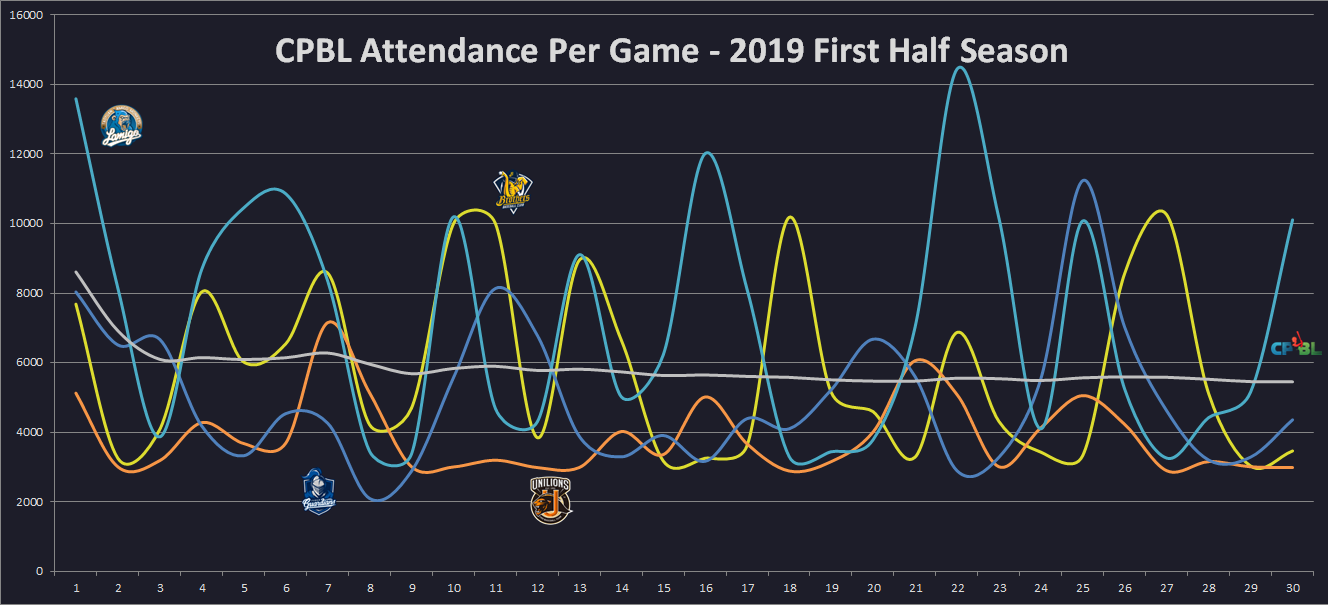
Attendance Chart Per Game: First Half Season
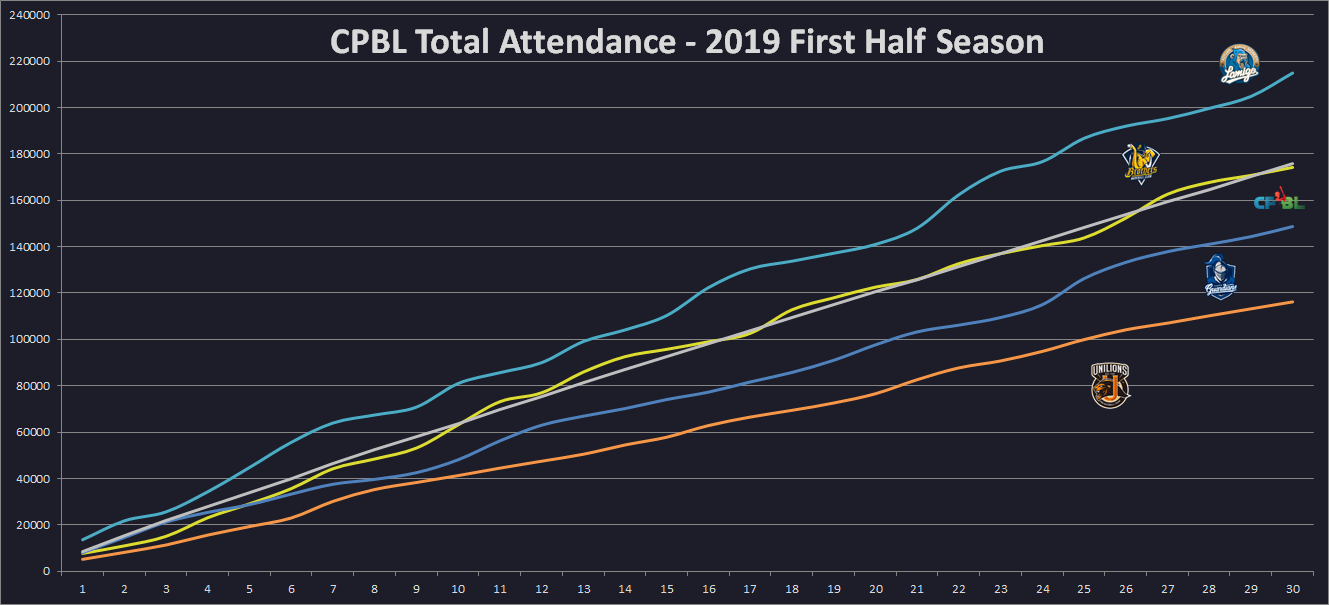
Total Attendance: First Half Season
- Lamigo Monkeys: 214,960 across 30 home games.
- Chinatrust Brothers: 174,251 across 30 home games.
- Fubon Guardians: 148,721 across 30 home games.
- Uni-Lions: 116,204 across 30 home games.
- CPBL: 654,136 across 120 games.
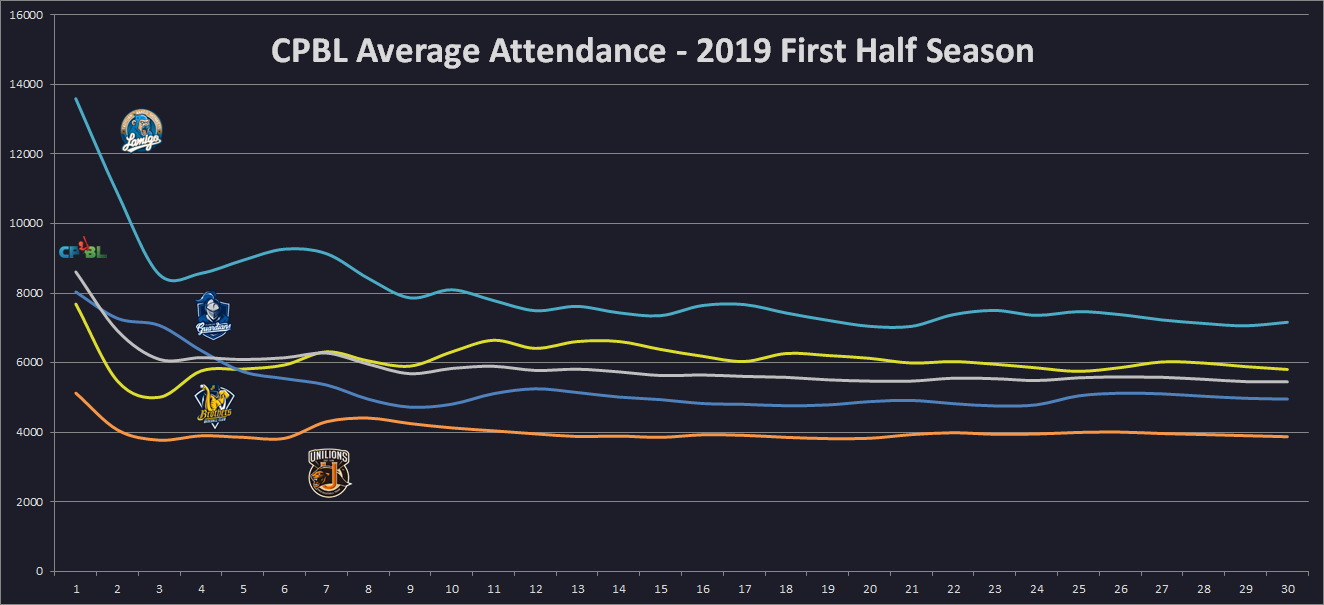
Average Attendance: First Half Season
- Lamigo Monkeys: 7165 across 30 home games.
- Chinatrust Brothers: 5808 across 30 home games.
- Fubon Guardians: 4957 across 30 home games.
- Uni-Lions: 3873 across 30 home games.
- CPBL: 5451 across 120 games.
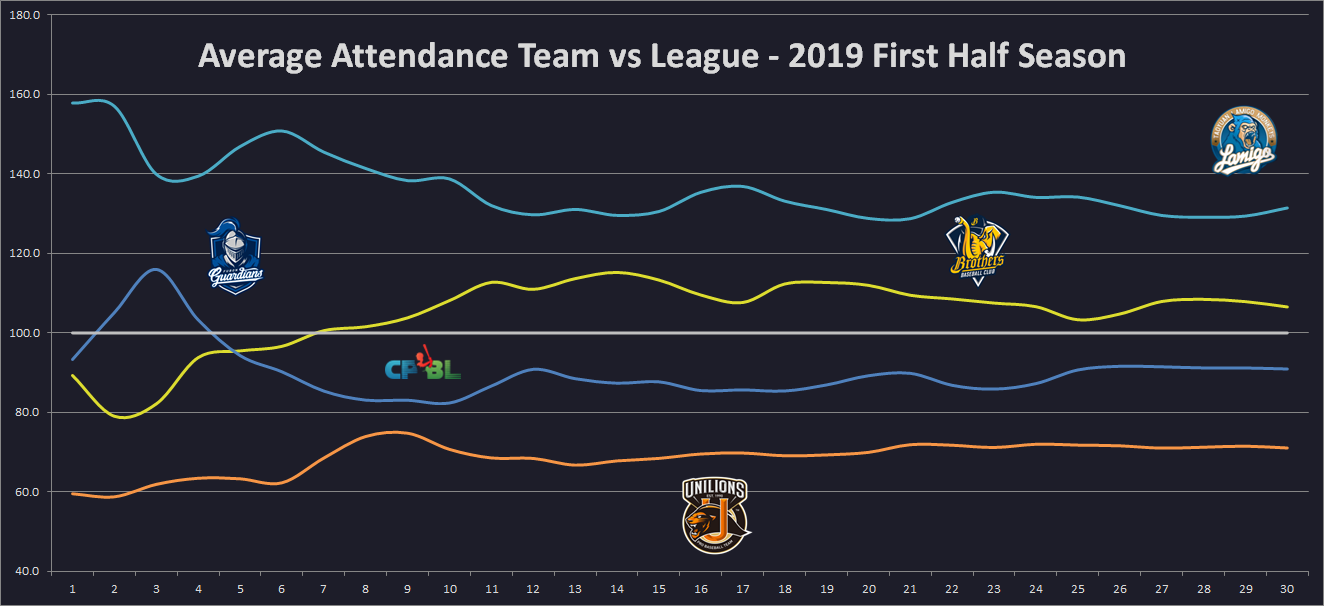
Attendance Plus: First Half Season
Here is the “average team attendance vs the average league attendance”. In a way, I guess we can call it “The Attendance Plus / ATT+”. Just think of this as the “OPS+”, but for team attendance.
So, how do we use this? The league average will equal to 100. If a team’s ATT+ is 160, then the team is performing 60% better than the average league attendance. Whereas if a team’s ATT+ is at 60, then that team is 40% lower than the average league attendance.
- Lamigo Monkeys: 131 ATT+ 31% above league average
- Chinatrust Brothers: 107 ATT+ 7% above league average
- Fubon Guardians: 91 ATT+ 9% below league average
- Uni-Lions: 71 ATT+ 29% below league average
Weekend vs Weekday Attendance
| Average Attendance | Monkeys | Brothers | Guardians | Uni-Lions | CPBL |
|---|---|---|---|---|---|
| Tuesday | 3528 | 4633 | 3094 | 2949 | 3605 |
| Wednesday | 3488 | 4310 | 3698 | 3044 | 3654 |
| Thursday | 5309 | 5504 | 3243 | 3001 | 4437 |
| Friday | 6209 | 4683 | 4879 | 3601 | 4906 |
| Saturday | 11300 | 8428 | 6552 | 4964 | 7931 |
| Sunday | 7503 | 5928 | 5742 | 4327 | 5813 |
| Week Day | 4971 | 4688 | 4024 | 3198 | 4224 |
| Weekend | 9673 | 7274 | 6178 | 4645 | 6950 |
| 1st Half Season | 7165 | 5808 | 4957 | 3873 | 5451 |
Attendance By City
| Stadium | Games | Average | Guardians | Monkeys | Brothers | Uni-Lions |
|---|---|---|---|---|---|---|
| Xinzhuang | 30 | 4957 | 4957 | - | - | - |
| Taoyuan | 30 | 7165 | - | 7165 | - | - |
| Taichung | 23 | 5421 | - | - | 5421 | - |
| Tainan | 23 | 3955 | - | - | - | 3955 |
| Kaohsiung | 9 | 4604 | - | - | 6220 (4) | 3312 (5) |
| Tianmu | 5 | 6677 | - | - | 8233 (3) | 4342 (2) |
CPBL Attendance: 2016-2019 First Half
- 2016 First Half: 743,630 total across 120 games
- 2017 First Half: 691,356 total across 120 games
- 2018 First Half: 700,254 total across 120 games
- 2019 First Half: 654,136 total across 120 games

- 2016 First Half: 6197 average across 120 games
- 2017 First Half: 5761 average across 120 games
- 2018 First Half: 5835 average across 120 games
- 2019 First Half: 5451 average across 120 games

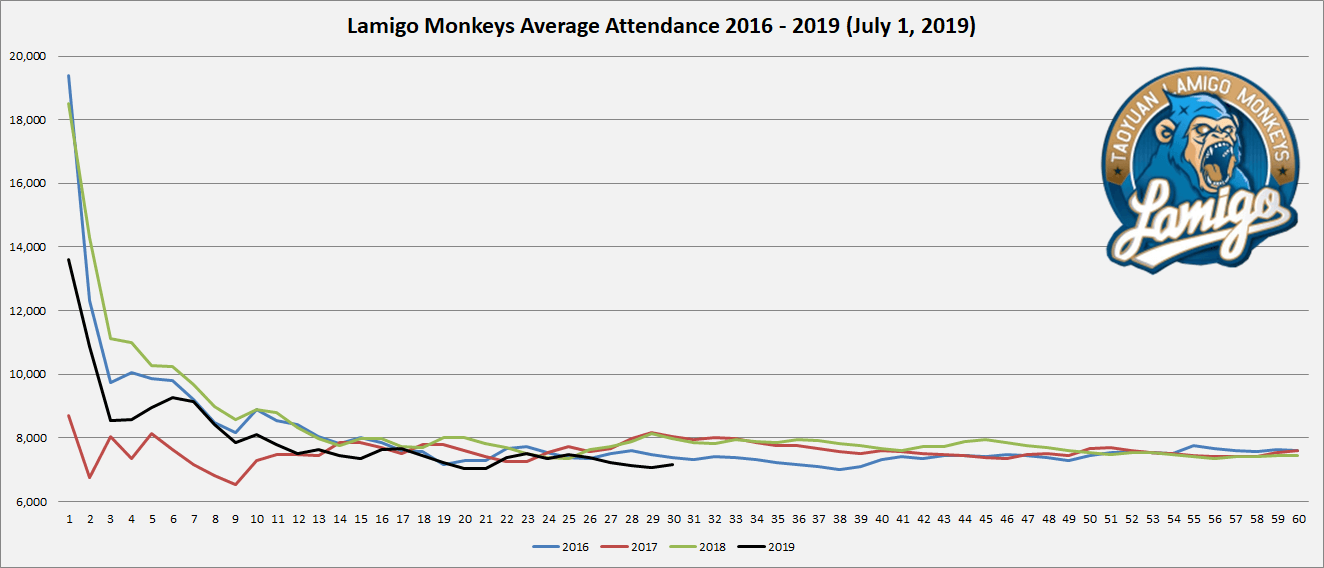
Lamigo Monkeys Attendance: 2016-2019 First Half
- 2016 First Half: 221,830 total across 120 games
- 2017 First Half: 241,317 total across 120 games
- 2018 First Half: 239,807 total across 120 games
- 2019 First Half: 214,960 total across 120 games
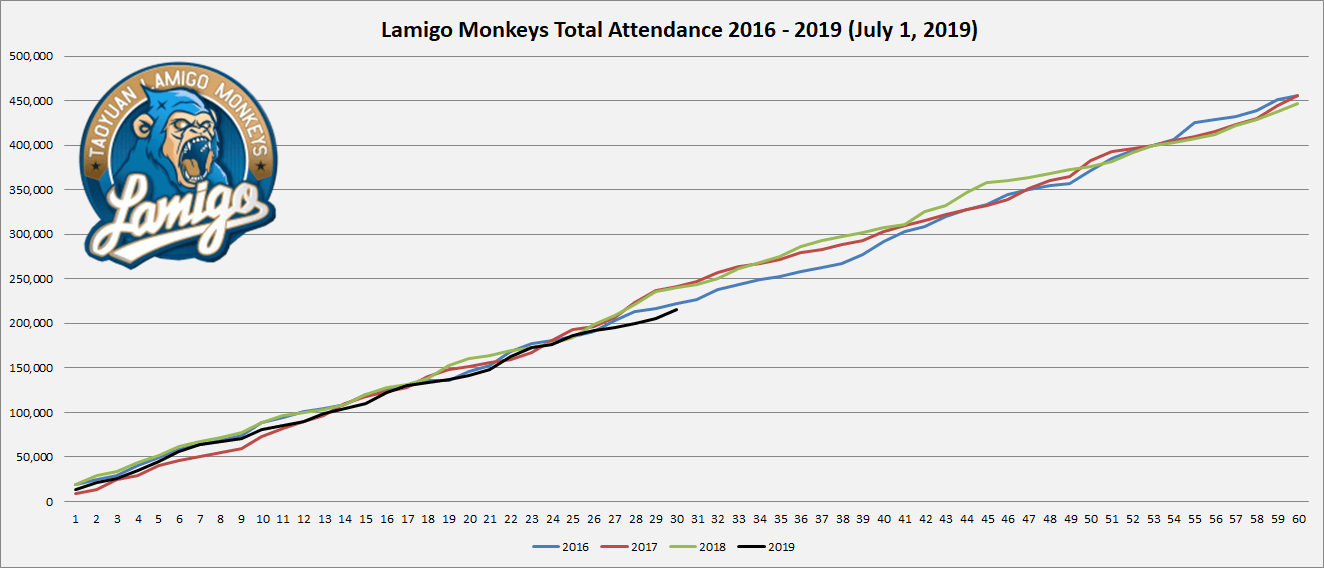
- 2016 First Half: 7394 average across 120 games
- 2017 First Half: 8044 average across 120 games
- 2018 First Half: 7994 average across 120 games
- 2019 First Half: 7165 average across 120 games
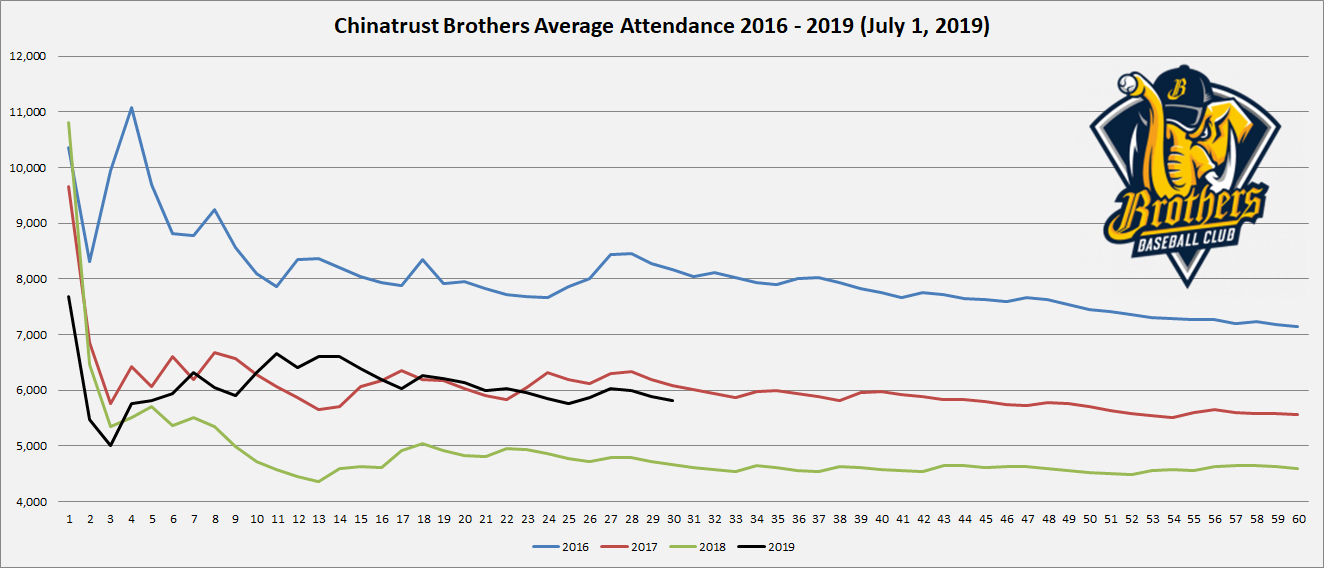
Chinatrust Brothers Attendance: 2016-2019 First Half
- 2016 First Half: 244,917 total across 120 games
- 2017 First Half: 182,243 total across 120 games
- 2018 First Half: 139,732 total across 120 games
- 2019 First Half: 174,251 total across 120 games
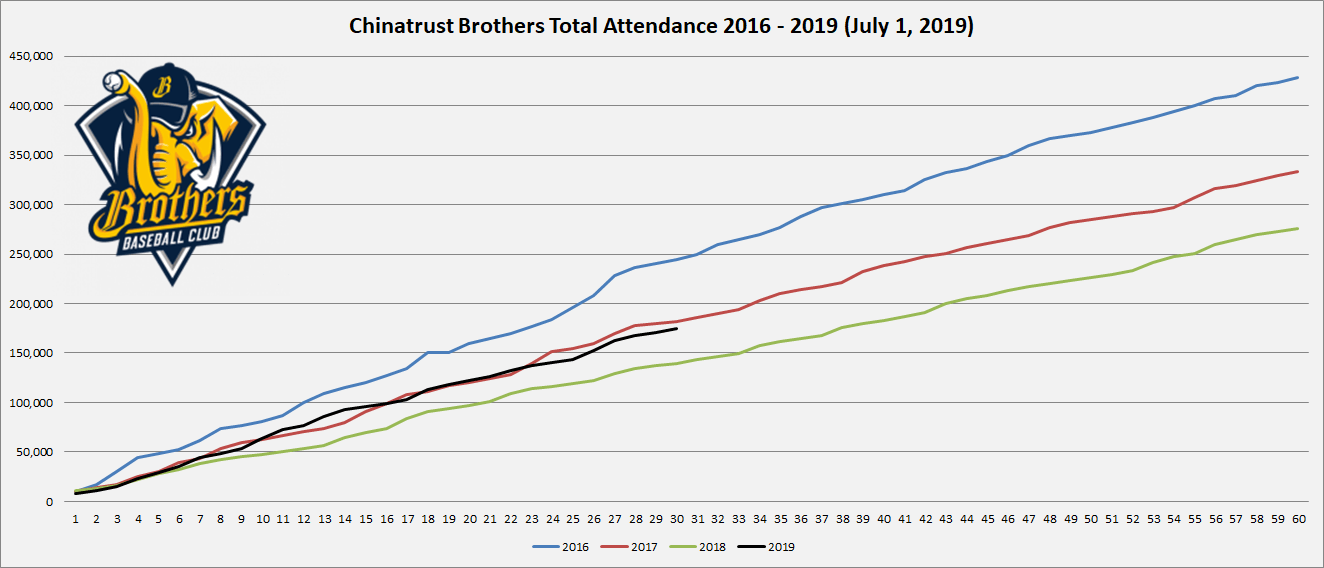
- 2016 First Half: 8164 average across 120 games
- 2017 First Half: 6075 average across 120 games
- 2018 First Half: 4658 average across 120 games
- 2019 First Half: 5808 average across 120 games
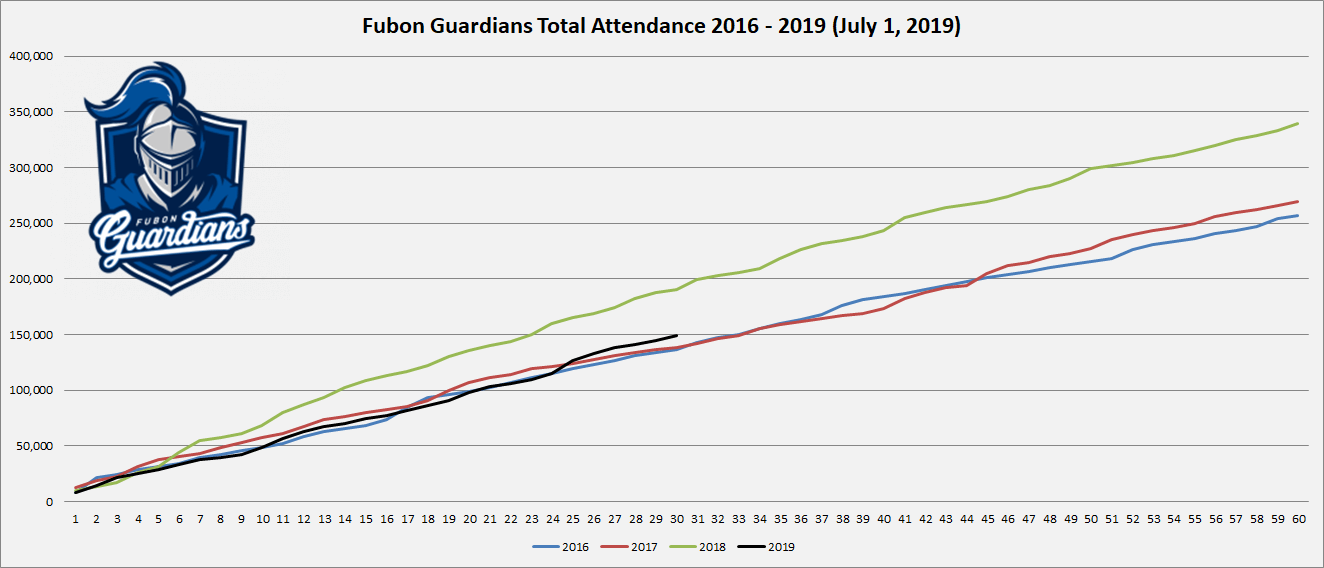
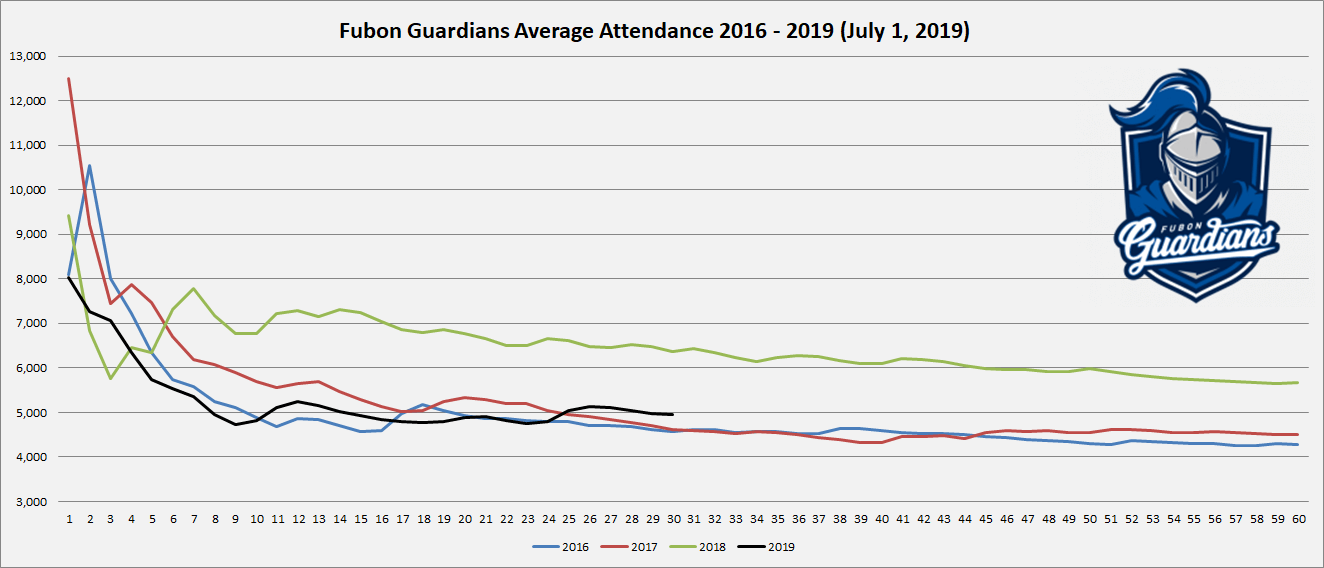
Fubon Guardians Attendance: 2016-2019 First Half
- 2016 First Half: 136,905 total across 120 games
- 2017 First Half: 138,507 total across 120 games
- 2018 First Half: 190,787 total across 120 games
- 2019 First Half: 148,721 total across 120 games
- 2016 First Half: 4564 average across 120 games
- 2017 First Half: 4617 average across 120 games
- 2018 First Half: 6360 average across 120 games
- 2019 First Half: 4957 average across 120 games
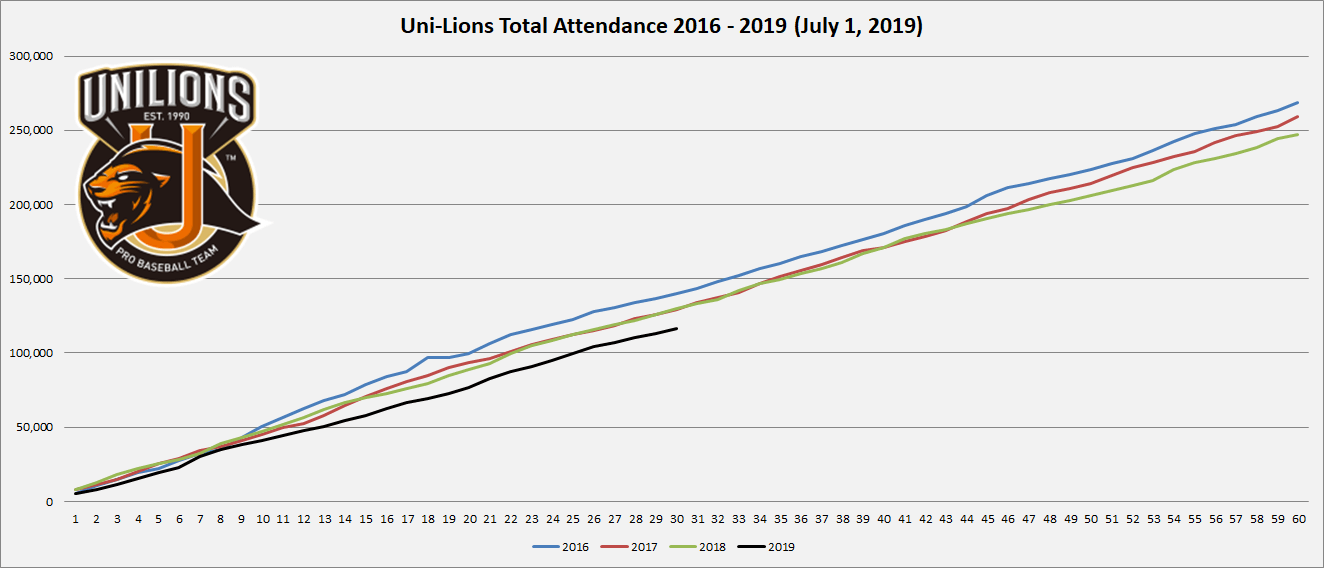
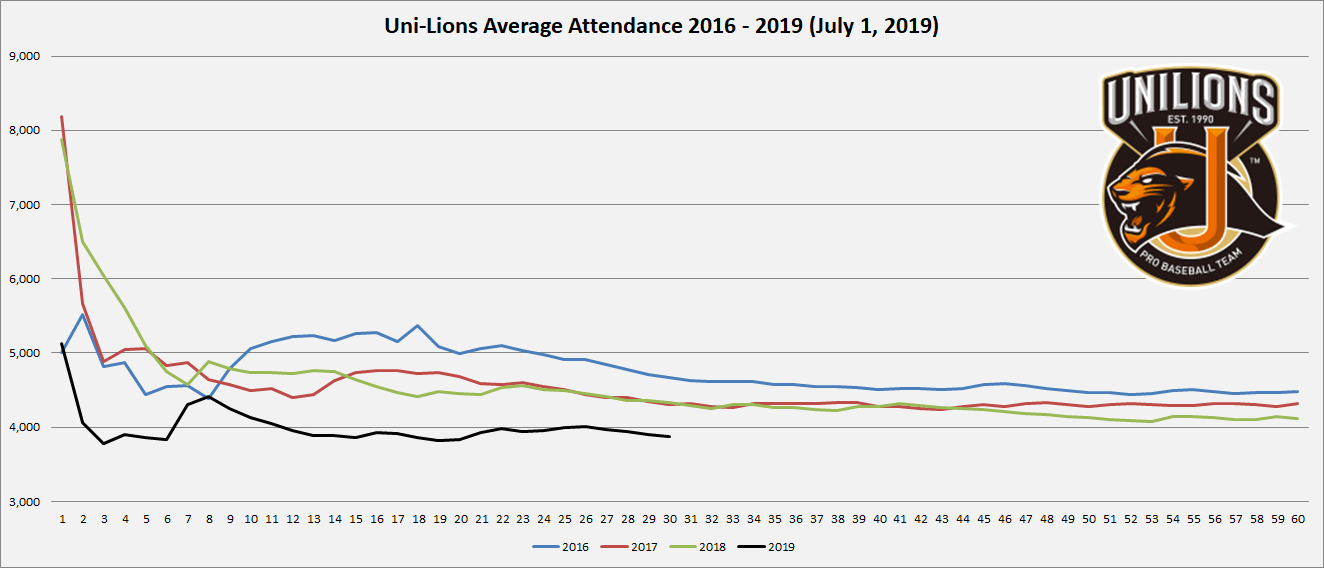
Uni-Lions Attendance: 2016-2019 First Half
- 2016 First Half: 139,978 total across 120 games
- 2017 First Half: 129,289 total across 120 games
- 2018 First Half: 129,928 total across 120 games
- 2019 First Half: 116,204 total across 120 games
- 2016 First Half: 4666 average across 120 games
- 2017 First Half: 4310 average across 120 games
- 2018 First Half: 4331 average across 120 games
- 2019 First Half: 3873 average across 120 games


How does 2019 first half attendance compare to 2018, 2017 and 2016 first half attendance?
Can’t answer now, because I don’t have my spreadsheet in front of me. I will update this blog post on Monday when I get back to the office. But I suspect maybe a 2-5% drop comparing with 2018.